 At Boise Cascade, our goal is for nobody to get hurt, and we strive for continuous improvement in our year-over-year performance metrics through numerous processes.
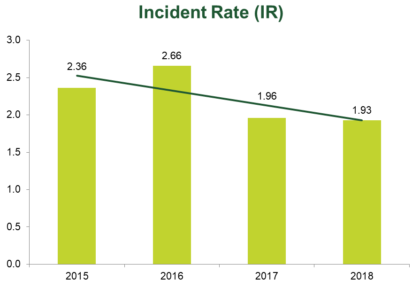
Our incident rate, an industry-recognized measure of safety, is one performance metric we track to monitor year-over-year improvement. In 2018, our incident rate was 1.93 down from 1.96 in 2017 and a significant improvement over the 2016 rate of 2.66.
Annual safety goals are set at our locations with each of them implementing the programs needed to achieve those goals so they meet their business or region-specific needs.
We recognize achieving zero injuries will take significant effort on the part of everyone at Boise Cascade, but we are committed to safety and hold it as a value, not simply an initiative.
Tracking progress
Boise Cascade uses a comprehensive safety management system, to track our incident administration and provide the data that will help us identify areas of success and opportunities for improvement.
This collection of information on all incidents, near misses, hazard identifications, pre-task job safety analysis, audits, safety meetings and worker observations has allowed us to identify our top opportunities for performance improvement.
Embedding assessment into our processes and systems promotes integrated thinking, which drives better decision-making at all levels and improves performance.
Measurements
When it comes to metrics, aggregated results are reported on a monthly basis. We share metric results containing summarized numbers and links to details through cascaded email and a news post on our internal employee portal. Some of our employees have limited access to email and our intranet, so we also share the results in our breakrooms on the bulletin boards and using digital signage where available.
Communication of results helps our employees connect how the effort of collecting and evaluating metrics leads to tangible, meaningful improvements to safety. It positively reinforces and acknowledges improvements made and encourages continual safe behaviors in our workplace.
Results
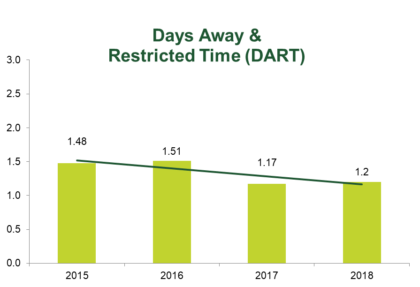
As part of our goal to reach a world-class safety standard, it is crucial we share our goals, progress towards those goals, and where our journey has taken us. We measure our performance through Days Away & Restricted Time (DART) and Incident Rate (IR) metrics.
In our efforts to reduce the occurrence of injuries, occupational diseases, or work-related fatalities, we monitor additional information to help reduce incidents.
We track the overall effectiveness of safety at our facilities to find out how many people got hurt and how badly. These are “lagging indicators” that tell us how well we are doing at preventing accidents and incidents.
The lagging indicators we track are:
- property damage incidents
- workers compensation costs
- OSHA recordable incident rate
We also track the activities we do to achieve the outcome we desire. These “leading indicators” keep us focused on future safety performance and continuous improvement. Proactive in nature, this helps us know what our employees are doing on a regular basis to prevent injuries.
The leading indicators we monitor are:
- hazard identifications
- peer-to-peer observations and interventions
- pre-task analysis
- near misses
- completed RADAR submissions and task stops
- percentage of corrective actions completed under 30 days